Price Action
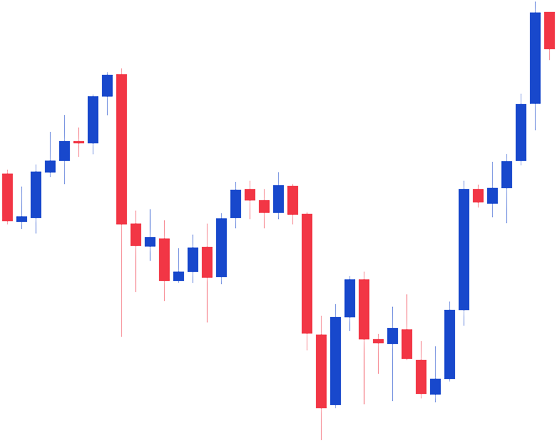
The price action analysis involves looking at the price’s behavior during each one of the previous periods. assuming you trade on the 1-hour time frame, it means that every “candle” (small bar, either blue or red, with sometimes upper and lower wicks) represents an hour. The last candle, on the right of the chart, corresponds to the current hour. As soon as the hour ends, the chart will move on the left in order to make a new candle appear. this last new one will finish at the end of the new current hour.
As a consequence, each previous candle reveals the past. it’s like a data book where everything is saved. The color, the size, the wicks, the body and the shape of the japanese candles provide previous market details.
Furthermore, some sets of candles can also give you useful data about market reversal, trend continuation or stagnation. there are lots of shapes (called chart patterns) known by the professional traders such as the cup & handle, the wedges and so many other ones.
To my mind, the price action analysis is an inevitable learning. But, you can significantly improve your success rate thanks to technical indicators.
Technical Indicators
There are plenty
of technical indicators very useful to help you analyzing the charts.
You must consider them like a help instead of a mean. Indeed, they guide the
price action analysis that must prevail over everything else.
The indicators have different use
cases. Some of them, like Ichimoku Kinko Hyo, the Bollinger bands, the moving
averages and the supertrend, are very useful to help you trading in a trend
(bullish or bearish) but useless to perform in a range (when the market
oscillates horizontally without making higher highs or lower lows).
Other indicators, called
oscillators, are pretty amazing to indicate abnormal situations like during
high-volatility periods, overbought or oversold markets and hidden trend
weaknesses. One of my favorite oscillator is called the Relative Strength Index
(or RSI) ; it’s very useful to detect overbought and oversold situations but
also divergences (hidden market weaknesses) in order to prevent me from doing a
mistake.
Without these technical
indicators, my rate of return would probably be weaker than with them. But,
everything depends on the money management. there are as many strategies
as traders. To my mind, I prefer taking less trades but with a bigger
probability to succeed than taking a lot of orders with a lower success rate.


Money Management
The money management will definitely make the difference between the bad & the efficient trader. To be honest, learning the analysis technics (price action & technical indicators) is pretty easy. Everyone can be an analyst but a few people can become a trader. Do you know why ? Indeed, it’s written in the title : money management. A few people respect a scrupulous & fastidious management. Lots of traders want to make thousands of dollars quickly & start gambling, cut their positions when they’re right & let their losses run hoping for a reversal that never occurs at the right time.
If you don’t set rules and never stick to them, believe me you’ll never succeed being an independent trader.
First of all, you must be familiar with the risk/reward ratio. It is the ratio of the money you’re risking divided by the reward you need to exit your trade. For instance, if you invest 200$ in order to get 600$, the risk/reward ratio is equal to 200/600=1/3=0.33.
Then, if you want to significantly multiply your profits you should reinvest them through time. As a consequence, you’ll discover the power of the compound interests.
Compound Interests

With T : Total capital after n years ; I : Initial invested capital ; R : annual Rate of interest ; n : number of years with this R-rate.
Do you know this formula ? This is the compound interests equation. assuming that you’ll never withdraw your money from your trading or investment account during a “n” period of time and that each annual rate of interest will be the same, you can calculate your future profits and capital thanks to the compound interests. Ready to discover the secret of all the billionaires ?
Let’s start with an initial capital of 10 000$ invested in stocks with dividends and in trading (short term). This strategy provides an average rate of interest equal to 20% annually. How much would your capital increase within 10 years ? You’d get 61917.36$, that’s to say 6.19 times your initial investment (total rate of return = 519%).
Now, compare this strategy with a trader or investor who doesn’t use the compound interests and withdraws his money at the end of each year. Taking into account the same data, he would get 10 years x 20% x 10000$ + 10000$ = 30000$, only twice his initial investment (total rate of return = 200%). So, thanks to the compound interests, on a 10-year period, we’ve more than doubled the capital compared to the guy that doesn’t know anything about them.

Fundamental vs. Technical Analysis
As you already know, the technical analysis refers to the live market evolution on a chart. It only refers to the price. It is a consequence of the supply and demand. The market increases when the demand exceeds the supply and vice-versa.
However, the fundamental analysis intervenes before the consequence, before the price action. In other words, this type of analysis tries to anticipate the following market moves. It belongs to macroeconomics. For example, for analyzing companies you better use fundamentals instead of technical analysis (even if the technical analysis is important as well) as you invest on the long term.
Nevertheless, the fundamentals are often uncorrelated to the price action. Indeed, over the years, with the trading democratization and the central banks’ money printing, the rationality has disappeared from the markets. Nowadays, a decisive facet is born when talking about stocks : fashion. Indeed, the common data such as the balance sheet aren’t sufficient anymore. If a brand is considered like “cool” or innovates for climate change, even if it’s overly indebted or doesn’t have any tangible assets, its value can increase significantly. The rationality would take the actual data into account, it wouldn’t try to speculate about the future. For me, that’s why the fundamentals, even if essential in many cases, have their own limits.
Regarding the technical analysis, no matter the news, everything can be seen and anticipated. The good trader will wait for confirmations that will enable him to succeed. I admit that you won’t catch the bottom/top of the reversals but you’ll be in the right direction in most of the cases. What you see is real whereas what you think is either unreal or real.
However, a great strategy is to mix both types of analysis. The fundamentals indicate the long-term direction whereas the technical analysis validates thoughts on live. If you link both together you’ll definitely kill the game !